Web Dashboard
The web dashboard provides a browser-based interface for monitoring your herdctl fleet in real-time, interacting with agents via chat, and managing schedules and jobs.
Overview
Section titled “Overview”The @herdctl/web package embeds a full web dashboard into herdctl. When enabled, it serves a React-based single-page application alongside a REST API and WebSocket server. The dashboard provides:
- Fleet overview with real-time agent and job status
- Agent detail pages with live output streaming
- Interactive chat with agents using persistent sessions
- All Chats page showing every Claude Code session on the machine, including ones started outside herdctl
- Ad hoc chat to continue any CLI-started conversation from the dashboard
- Session origins showing where each conversation started (web, CLI, schedule, Discord, Slack)
- Schedule management with trigger, enable, and disable controls
- Job management with cancel, fork, and CLI command copying
- Theme support for light, dark, and system preference modes
- Toast notifications for action feedback
All updates are pushed to the browser in real-time over WebSocket, so the dashboard always reflects the current fleet state without manual refreshing.
Enabling the Dashboard
Section titled “Enabling the Dashboard”Configuration File
Section titled “Configuration File”Add a web section to your herdctl.yaml fleet configuration:
version: 1
fleet: name: my-fleet web: enabled: true port: 3232 open_browser: true| Field | Type | Default | Description |
|---|---|---|---|
enabled | boolean | false | Enable the web dashboard |
port | number | 3232 | Port to listen on |
host | string | "localhost" | Host to bind to |
session_expiry_hours | number | 24 | Chat session expiry in hours |
open_browser | boolean | false | Automatically open browser when starting |
CLI Flags
Section titled “CLI Flags”You can also enable the dashboard via CLI flags on herdctl start:
# Enable web dashboard on default port (3232)herdctl start --web
# Enable on a custom portherdctl start --web --web-port 8080
CLI flags override configuration file settings.
Accessing the Dashboard
Section titled “Accessing the Dashboard”Once the fleet starts with the web dashboard enabled, open your browser to:
http://localhost:3232You will see a log message confirming the dashboard URL:
[web] Web dashboard available at http://localhost:3232Dashboard Features
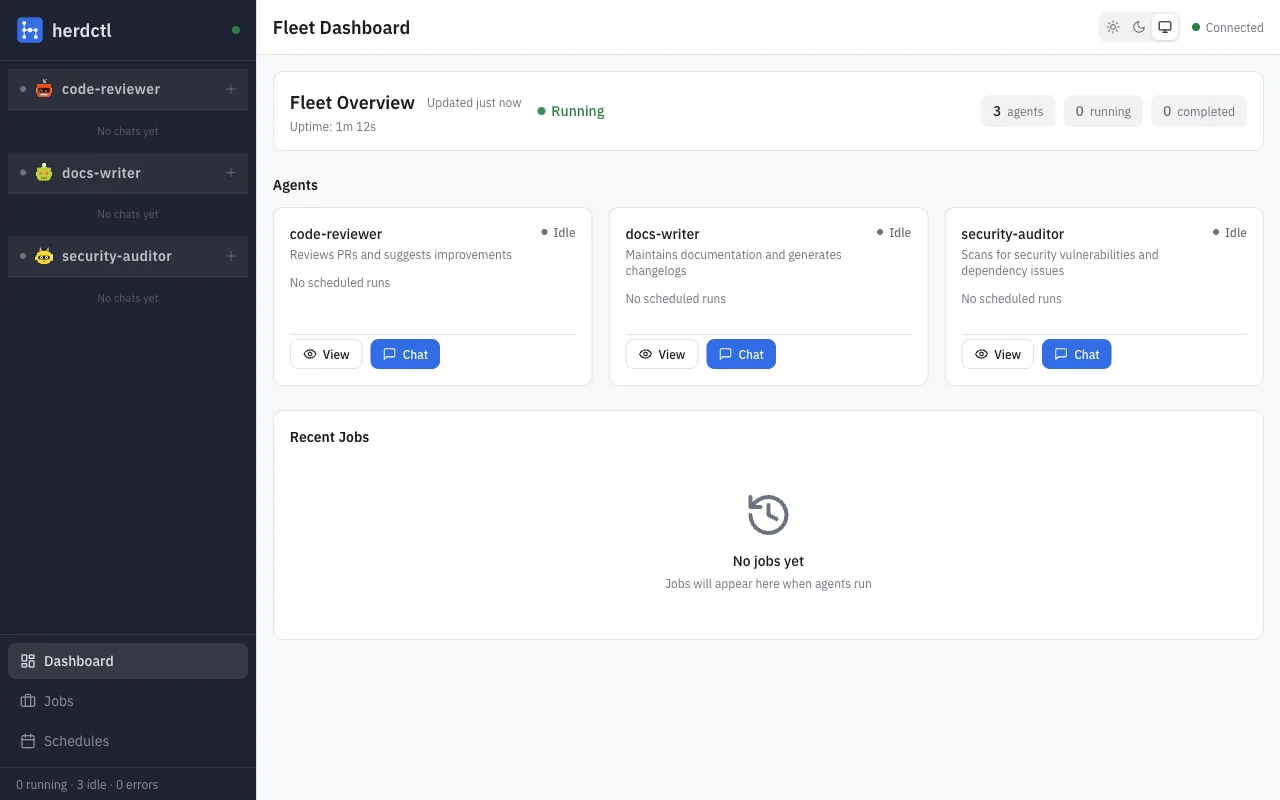
Section titled “Dashboard Features”Fleet Overview
Section titled “Fleet Overview”The main dashboard page shows a summary of your fleet at a glance:
- Fleet state (running, stopped, etc.) and uptime
- Agent cards showing each agent’s current status (idle, running, error)
- Recent jobs with status indicators
- Connection indicator showing WebSocket connectivity
Agent cards display the agent name, current status, running job count, and schedule count. Click an agent card to navigate to its detail page.
Sidebar Tabs
Section titled “Sidebar Tabs”The sidebar has two tabs at the top for switching between views:
- Fleet — Shows the agent hierarchy. Clicking an agent shows sessions attributed to that agent (herdctl-managed sessions only). This prevents duplicate sessions when multiple agents share a working directory.
- Chats — Shows recent conversations across all agents in chronological order, regardless of which agent owns them. Each conversation shows an origin badge, session name, and relative timestamp. You can search and filter conversations, rename them inline, or start a new chat via the command palette.
Fleet Grouping
Section titled “Fleet Grouping”When using fleet composition, the Fleet tab groups agents by their fleet hierarchy:
▼ herdctl ● security-auditor (running) ○ engineer (idle)▼ bragdoc ○ developer (idle) ○ marketer (idle)○ monitor (idle)- Fleet sections are collapsible and show the sub-fleet name
- Agents within a fleet display their local name (not the full qualified name)
- Root-level agents (those defined directly on the super-fleet) appear ungrouped
- Status indicators show running (filled dot) or idle (empty dot) state
Agent URLs use the qualified name (e.g., /agents/herdctl.security-auditor), ensuring unique paths even when multiple sub-fleets have agents with the same local name.
Each agent row is expandable to show its chat sessions. You can start a new chat with any agent using the + button on its row.
Agent Detail
Section titled “Agent Detail”The agent detail page provides deep visibility into a single agent:
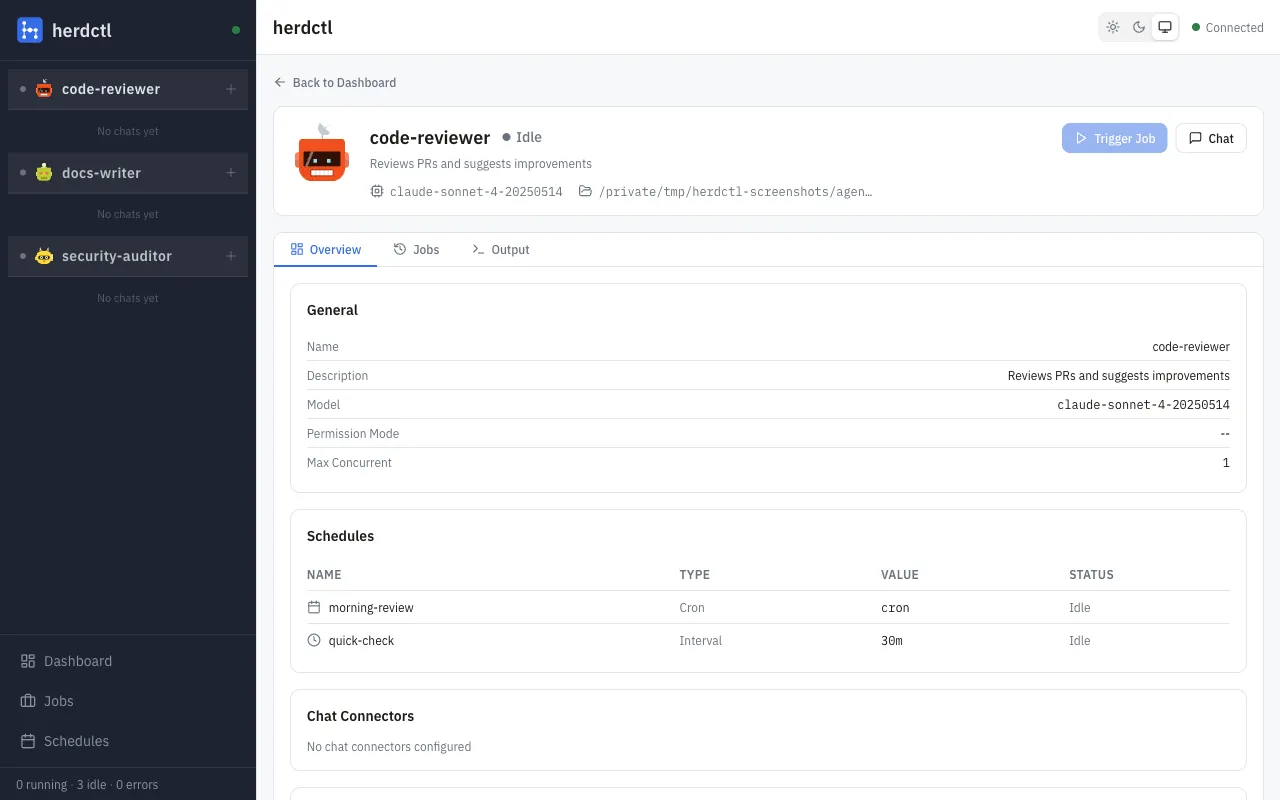
- Status and metadata including model, working directory, and permission mode
- Live output streaming for the current running job, updated in real-time over WebSocket
- Schedule list with controls to trigger, enable, or disable each schedule
- Job history for that specific agent
- Chat connector status showing Discord, Slack, and web chat states
Output streaming subscribes to the agent’s output events via WebSocket, so you see stdout and stderr as they happen.
Interactive Chat
Section titled “Interactive Chat”The chat feature lets you send messages to any agent directly from the dashboard:
- Create chat sessions per agent
- Send messages and receive streaming responses
- View message history with Markdown rendering
- Tool call visibility showing when the agent uses tools like Bash, Read, or Write, with collapsible details including input, duration, and output
- Multiple sessions per agent for separate conversation threads
- Session persistence across page reloads (sessions expire after the configured hours)
- Session names auto-generated from the conversation summary, with the option to rename any session inline
Chat messages are sent via WebSocket for low-latency streaming, with the full response appearing incrementally as the agent generates it. Tool calls appear as collapsible UI components in the message feed, allowing you to inspect what the agent did and the results it received.
Session Names
Section titled “Session Names”Sessions display an auto-generated name extracted from Claude Code’s conversation summary. The display priority is:
- Custom name — set by you via inline rename (click the pencil icon on any session)
- Auto-generated name — extracted from the JSONL summary field
- First message preview — the beginning of the first user message
- “New conversation” — fallback for empty sessions
Session Origins
Section titled “Session Origins”Each session shows a small origin badge indicating where the conversation started:
| Origin | Icon | Meaning |
|---|---|---|
| Web | Globe | Started from the web dashboard |
| CLI | Terminal | Started via claude CLI in the same working directory |
| Schedule | Clock | Started by a herdctl schedule trigger |
| Discord | Message bubble | Started via the Discord connector |
| Slack | Hash | Started via the Slack connector |
Origin badges appear in the sidebar, on the Chats tab, and on the All Chats page.
Sidechain Filtering
Section titled “Sidechain Filtering”Sub-agent sessions (created by Claude Code’s Task tool) and prompt-cache warmup sessions are automatically filtered out of the UI. This keeps the session lists focused on real conversations and avoids noise from internal Claude Code operations.
All Chats
Section titled “All Chats”The All Chats page shows every Claude Code session discovered on the machine, not just sessions started by herdctl. Access it from the All Chats link in the bottom navigation section of the sidebar.
Sessions are grouped by working directory, so you can see all conversations that happened in a given project. Each group is collapsible and shows the directory path, the associated agent (if any), and the number of sessions.
Within each group, sessions display:
- An origin badge (web, CLI, schedule, etc.)
- The session name (auto-generated or custom)
- A relative timestamp (e.g., “2h ago”)
- A read-only indicator for sessions that cannot be resumed from the dashboard
You can search and filter across all sessions by session name, working directory, or agent name. The search bar is at the top of the page.
Clicking a session opens it:
- herdctl sessions open in the normal interactive chat view for that agent.
- Resumable CLI sessions can be continued as ad hoc chats (see below).
- Non-resumable sessions open in a read-only view showing the full conversation history, with a copy-able
claude --resumecommand if you want to continue in your terminal.
Ad Hoc Chat
Section titled “Ad Hoc Chat”When you find an unattributed session on the All Chats page (one started via claude CLI rather than herdctl), you can click “Continue conversation” to start an interactive ad hoc chat session. This creates a new session that resumes the conversation from where the CLI session left off, running in the session’s original working directory.
Ad hoc chats behave like regular interactive chats — you can send messages and receive streaming responses — but they are not associated with any fleet agent.
Schedule Management
Section titled “Schedule Management”The schedules page lists all schedules across all agents with:
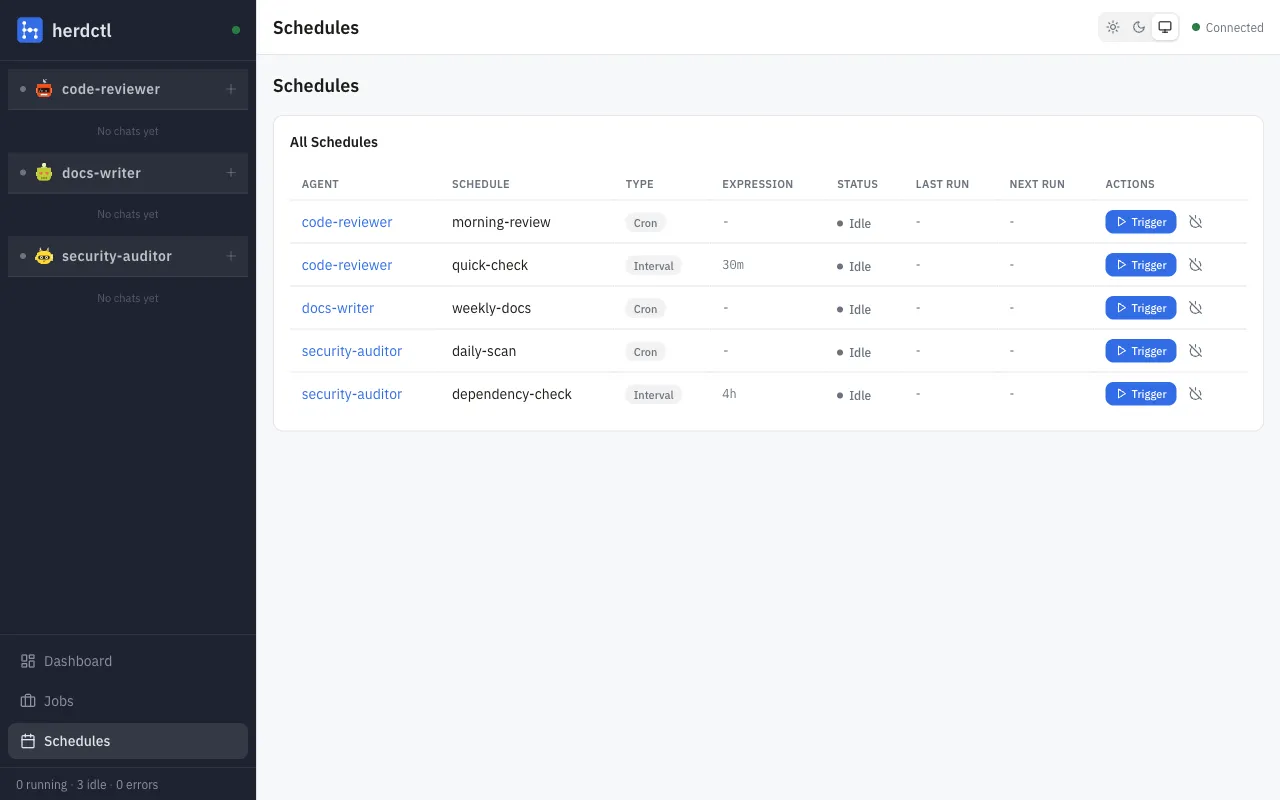
- Schedule type (interval, cron, webhook, chat)
- Current status (idle, running, disabled)
- Timing details (interval, cron expression, last run, next run)
- Action buttons:
- Trigger to immediately run an agent
- Enable/Disable to toggle a schedule on or off
Job Management
Section titled “Job Management”The jobs page provides a paginated, filterable list of all jobs:
- Filter by agent or status (running, completed, failed, cancelled)
- Pagination for browsing large job histories
- Job detail showing prompt, timing, exit code, and error information
- Actions:
- Cancel a running job (graceful or forced termination)
- Fork a completed/failed job to re-run it with optional prompt changes
- Copy CLI command to reproduce the job from the command line
Theme Support
Section titled “Theme Support”The dashboard supports three theme modes:
- Light - bright background with dark text
- Dark - dark background with light text
- System - automatically follows your operating system preference
The fleet overview in light and dark mode:
| Light Mode | Dark Mode |
|---|---|
| 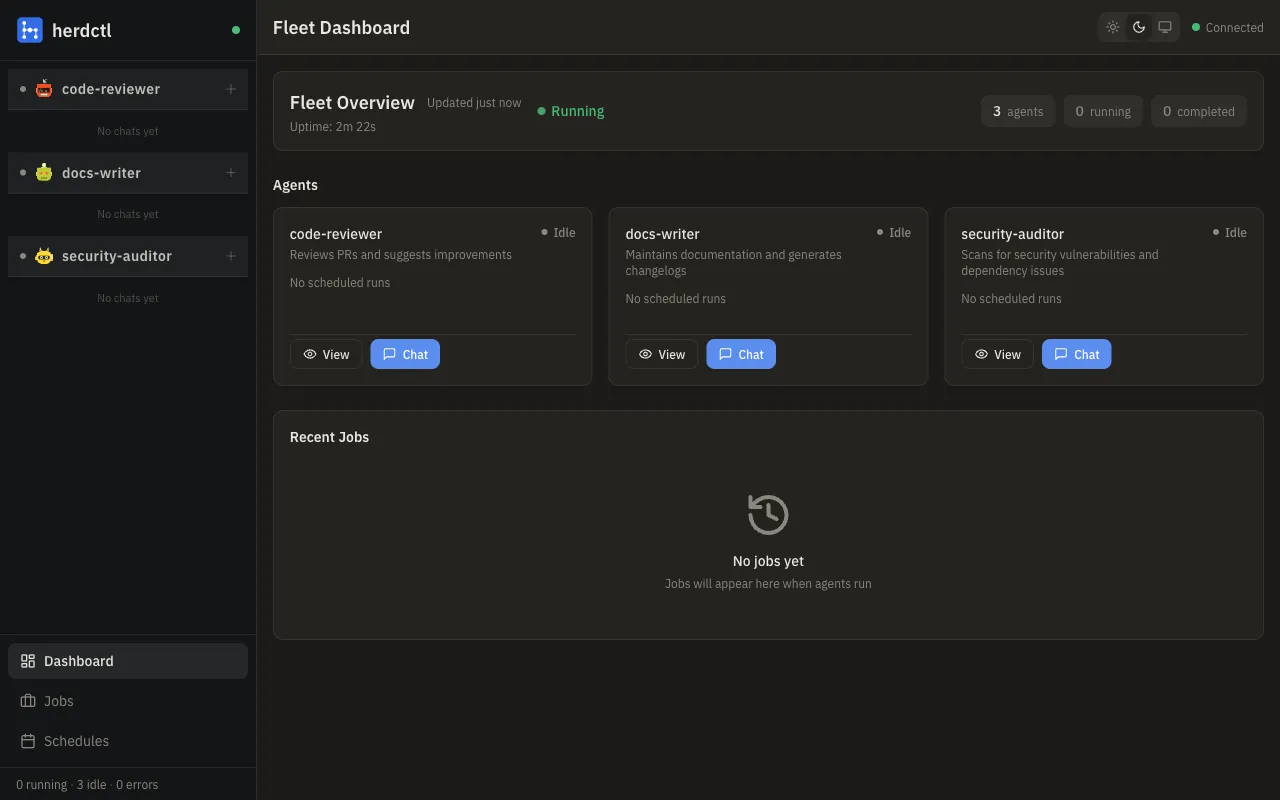 |
Theme selection persists across sessions via local storage.
Architecture
Section titled “Architecture”The web dashboard consists of:
- Fastify server serving the REST API, WebSocket endpoint, and static SPA files
- React SPA (built with Vite) that communicates with the server
- WebSocket connection for real-time event streaming from FleetManager
- Fleet Bridge that subscribes to FleetManager events and broadcasts them to connected clients
The server registers these API endpoints:
| Endpoint | Method | Description |
|---|---|---|
/api/fleet/status | GET | Fleet status snapshot |
/api/agents | GET | List all agents |
/api/agents/:name | GET | Single agent details |
/api/agents/:name/trigger | POST | Trigger a job for an agent |
/api/jobs | GET | Paginated job list with filters |
/api/jobs/:id | GET | Single job details |
/api/jobs/:id/cancel | POST | Cancel a running job |
/api/jobs/:id/fork | POST | Fork an existing job |
/api/schedules | GET | List all schedules |
/api/schedules/:agent/:schedule/enable | POST | Enable a schedule |
/api/schedules/:agent/:schedule/disable | POST | Disable a schedule |
/api/chat/recent | GET | Recent sessions across all agents |
/api/chat/all | GET | All discovered sessions, grouped by directory |
/api/chat/all/:encodedPath | GET | Sessions for a specific working directory |
/api/chat/sessions/by-path/:path/:id | GET | Session detail by working directory path |
/api/chat/:agent/sessions | GET/POST | List or create chat sessions for an agent |
/api/chat/:agent/sessions/:id | GET/DELETE | Get or delete a chat session |
/api/chat/:agent/messages | POST | Send a message to an agent |
/api/health | GET | Health check |
/ws | WebSocket | Real-time event stream |
Security
Section titled “Security”Localhost-Only Deployment
Section titled “Localhost-Only Deployment”By default, the dashboard binds to localhost (only accessible from the machine running herdctl):
web: enabled: true port: 3232 host: localhost # Default - secureNever bind to 0.0.0.0 without additional security controls. Doing so exposes all agent outputs, chat history, and fleet control to anyone on your network.
The web API provides unrestricted access to:
- Full chat history for all agents
- All job outputs and logs
- Ability to trigger jobs and modify schedules
- Session files that may contain credentials in error messages
Remote Access
Section titled “Remote Access”If you need remote access, use an authenticated reverse proxy:
Recommended: Caddy with HTTP Basic Auth
# Caddyfiledashboard.yourdomain.com { reverse_proxy localhost:3232 basicauth { admin $2a$14$hashed_password_here } tls you@example.com}This keeps herdctl bound to localhost while providing authenticated HTTPS access through Caddy.
See the Web Dashboard Security section in the Security Guide for detailed guidance, alternative authentication patterns, and best practices.
Requirements
Section titled “Requirements”- Node.js 18+
- A modern browser (Chrome, Firefox, Safari, Edge)
- herdctl fleet running with
web.enabled: true
Related Pages
Section titled “Related Pages”- Fleet Configuration - Fleet-level configuration reference
- Agent Configuration - Individual agent settings
- Jobs - How jobs work in herdctl
- Schedules - Schedule types and configuration